What is Data Aggregation?
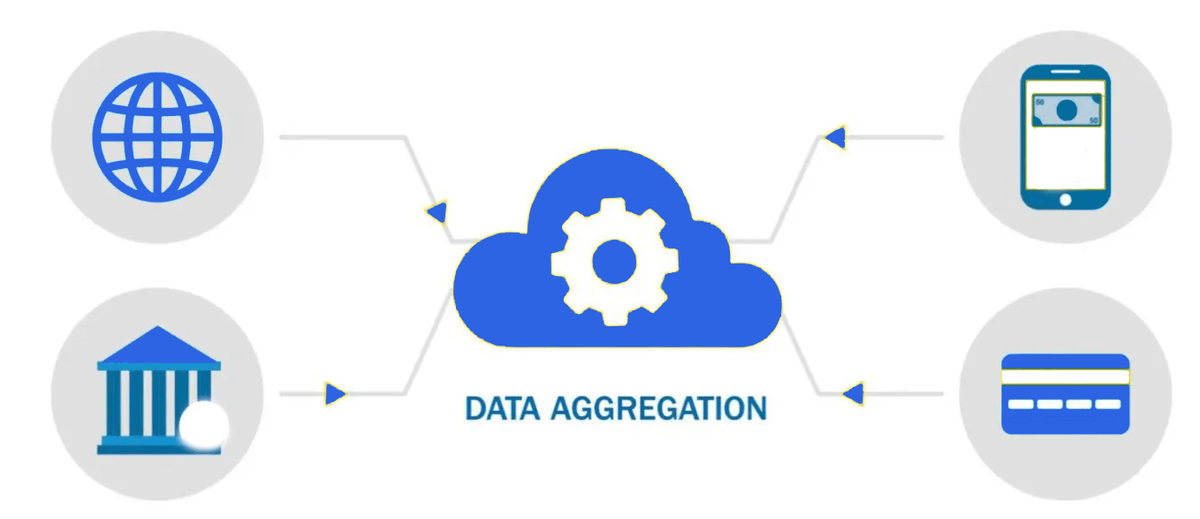
Data aggregation is the process of collecting and summarising data from multiple sources into a single location. This process involves grouping related data points and calculating statistical measures to provide a more comprehensive understanding of the data.
Why is Data Aggregation Important?
- Simplifies Data Analysis: By condensing large datasets into more manageable summaries, data aggregation makes it easier to identify trends, patterns, and anomalies.
- Enhances Decision Making: Aggregated data can be used to make informed decisions by providing insights into key performance indicators, customer behavior, and market trends.
- Improves Efficiency: Data aggregation can streamline reporting processes and reduce the time and effort required to analyze data.
Key Techniques for Data Aggregation
Grouping:
- Categorical Grouping: Grouping data based on categorical attributes, such as age group, gender, or product category.
- Numerical Grouping: Grouping data based on numerical values, such as income range or sales volume.
- Hierarchical Grouping: Grouping data into multiple levels, creating a hierarchical structure.
Statistical Measures:
- Sum: Adding up all values in a group.
- Average: Calculating the mean value of a group.
- Median: Finding the middle value in a group.
- Mode: Identifying the most frequent value in a group.
- Minimum and Maximum: Determining the smallest and largest values in a group.
- Variance and Standard Deviation: Measuring the spread of data within a group.
- Count: Counting the number of data points in a group.
Data Aggregation in Different Contexts
Business Analytics:
- Analyzing sales data to identify top-selling products.
- Tracking customer behavior to improve marketing campaigns.
- Measuring employee performance to identify areas for improvement.
Healthcare:
- Analyzing patient data to identify risk factors and improve treatment outcomes.
- Tracking disease prevalence to inform public health policies.
Finance:
- Analyzing market data to identify investment opportunities.
- Assessing financial risk to make informed decisions.
Government:
- Analyzing census data to understand population demographics.
- Tracking economic indicators to monitor the health of the economy.
Challenges and Considerations
- Data Quality: Ensure that the data being aggregated is accurate, consistent, and complete.
- Data Privacy: Protect sensitive data and comply with relevant privacy regulations.
- Data Security: Implement measures to prevent unauthorized access to aggregated data.
- Data Governance: Establish guidelines and policies for data aggregation and usage.
- Real-World Example: Analyzing Sales Data
Imagine a retail company that wants to analyze its sales data to identify its most profitable products. They can aggregate sales data by product category, region, and time period. By calculating the total sales, average sales price, and profit margin for each product category, they can identify which products are driving the most revenue and profitability.
Conclusion
Data aggregation and SQL are powerful tools for extracting meaningful insights from large datasets. By effectively grouping and summarising data, organisations can make informed decisions, improve efficiency, and gain a competitive advantage. Whether you are pursuing a data analytics course in Delhi, Noida, Mumbai and other Indian cities or looking to enhance your skills independently, mastering these concepts is essential for success in today’s data-driven world.
